Level of Maturity
Once the risk rating process is completed, all vulnerabilities should be complemented with a specific rating for their impact and for their likelihood.
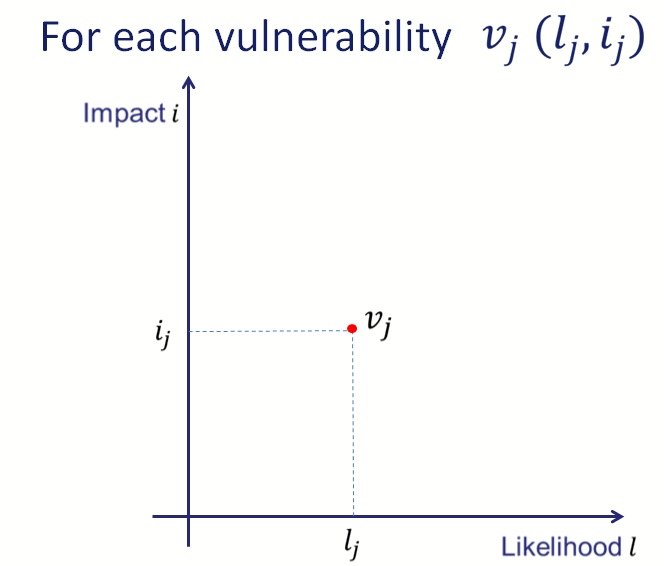
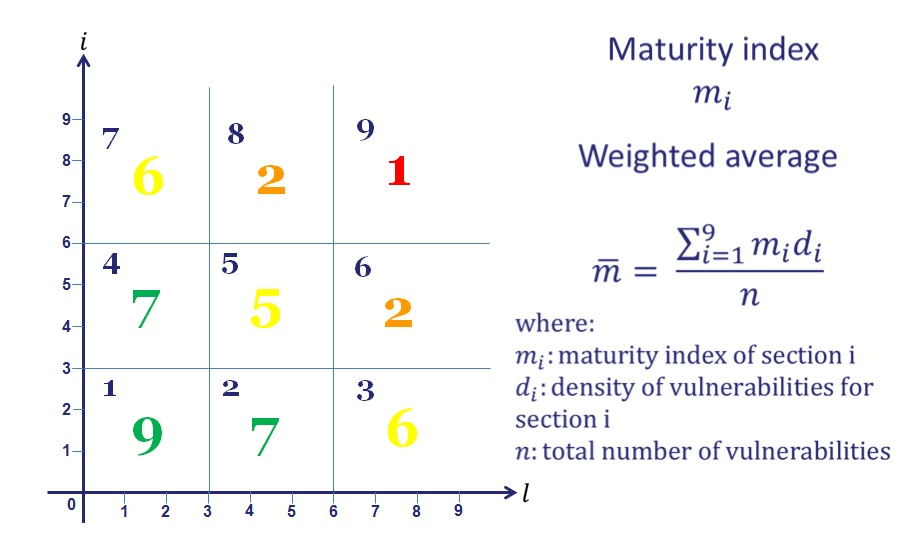
Since the methodology aims to determine the level of maturity as a measure of how resilient is a particular electoral implementation to the potential vulnerabilities identified for each phase on the light of the provided criteria (accuracy, transparency, accountability, speed, flexibility, integrity, reach, equality and anonymity); the next step is to plot the ratings obtained for all vulnerabilities in a graphic of Impact vs. Likelihood.
In this graphic each point vj represents the risk of the vulnerability and is represented by the pair (lj, ij).
vj(lj, ij)
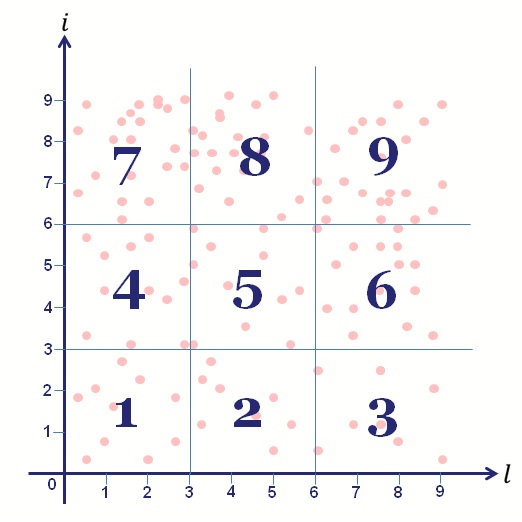
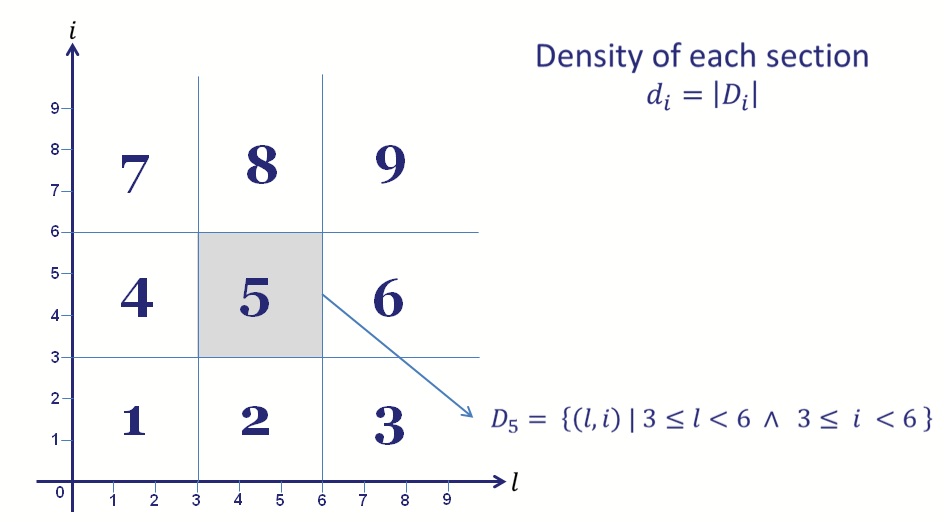
As the ratings were defined in a scale from 0 to 9 were 0 represents a complete mitigation of risk, the graphic will be divided into 9 sections whose limits come from the intersection at points 3 and 6 of both axes: likelihood (X) and impact (Y). Each section has an identifier, sections are numbered incrementally from left to right and bottom to top. Furthermore each section has a number that indicates its relevance according to the combination of impact and likelihood present within its area. The sections are numbered from bottom to top and from left to right.
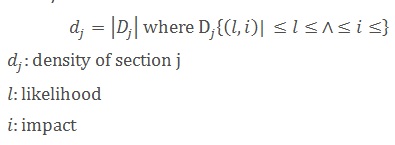
Next, the density of each section is calculated in terms of the number of risk ratings inside each section. In set theory terms:
With the densities of each of the 9 sections calculating, the following step is to determine the average Relevance weighted to the density of each section
The level of maturity then comes from calculating the weighted average obtained before. This is because represents a measure of risk, so higher values represent highest exposure and thus, lower maturity.
- Maturity levels range from 0 to 9 and have a finite decimal representation.
- Incorporation of technology tends to bring vulnerabilities to the lower-left area thus increasing the maturity level of a particular implementation.
The natural conclusions that derive from this methodology for calculating maturity are:
- The approach of the methodology is conservative; vulnerabilities in the upper and right-most area of the graphic are more relevant than those on the lower-left area.
- There are a total of 9 maturity levels.

